
DYNAMIC ALPHA
MACRO FUND
Monthly Commentary
September 2026
Macro Observations and Market Analysis
This Month’s Performance
The Dynamic Alpha Macro Fund declined in September, giving back most of August’s gain and leaving the fund roughly flat over the past three months. Full performance for the fund and its benchmarks, including standardized returns, appears in the Performance Metrics section following this commentary.
Last month we wrote that there will be months of underperformance and months of outperformance, and that this, by definition, is diversification. September was the other side of that coin: the same independence from the stock market that helped in August worked against us, in a month when stocks were roughly flat. Non-correlation is not the same as a hedge. It means our returns come from different drivers than the stock market’s, and in any given month those drivers can move for us or against us.
A Sharp Reversal
The macro backdrop turned quickly. On September 16, the Federal Reserve raised its policy rate by 25 basis points, to a target range of 3.75% to 4.00%. Treasury yields rose and the U.S. dollar firmed, a difficult combination for many of our positions. Our lone contributor was a long position in NY Harbor Heating Oil Futures, which we closed before month-end.
September continued a pattern this year in which promising months are followed by sharp reversals. This is frustrating, yet also a normal part of trading liquid markets. We put on our best ideas, and stick with them, knowing that in the near-term many trades will reverse and zig-zag.
Although tempting, shortening our horizon to capture quick profits is, in our experience, a costly long-term mistake – much of the compounding of capital in investing tends to come from a small number of positions that pay off in a large way. Failing to capture these big moves leads to poor long-term outcomes, whether investing in equities or in commodities.
Our Core Themes
Despite the setback, our core themes – long gold, short USD (expressed through long Japanese yen and long British pound), long select agricultural commodities, and long copper – remain intact from a fundamental and technical standpoint. Our conviction in the positions we hold remains high.
Gold (long)
September’s pullback does not change our view. Corrections are a normal feature of young secular bull markets, and our thesis rests on sustained demand from central banks diversifying their reserves, a trend we believe has years left to run.
Short U.S. dollar (long British pound and Japanese yen)
The dollar’s September rebound worked against our long British pound and Japanese yen positions. As we noted last month, our view rests on capital flows rather than interest-rate differentials, and the Bank of Japan’s September 18 decision to raise its policy rate to 1.25%, its highest level since 1995, is consistent with that shift.
Agriculture (long corn, long sugar, short live cattle)
Our agricultural positions are deliberately independent of financial markets, and in September all three (long corn, long sugar and short live cattle) detracted. We continue to hold each: in our view, crop yields are under pressure, and the cattle cycle is approaching a top as consumers push back against high beef prices.
Copper (long)
We have a long-term horizon for most of our investments, and copper is a good example. We believe we are in the early stages of a multi-year copper bull market, reflecting what we see as a supply/demand imbalance in a metal that is critical to the energy transition. September tested that view: copper set records on the London Metal Exchange early in the month before falling on a September 10 report that a planned U.S. tariff on refined copper had stalled. We express the theme solely through long copper futures.
Two Themes on the Sidelines
What’s even more interesting are two themes that we do not have in the portfolio currently: short S&P 500 and long Treasuries. We’ve been wrong about these two positions on-and-off recently, hitting our risk point on attempted trades. Given the technical price action of each, we are stepping aside for now and watching each closely, ready to reimplement either at a moment’s notice. Fundamentally, however, our conviction that we are in the late stages of a bubble in AI-related stocks (essentially a bubble in the broader stock market itself given how large tech has become) hasn’t wavered. Likewise, with Treasury bonds out of favor, we believe a bursting stock market bubble would create a negative wealth effect that could drive yields far lower than today’s levels. We believe both trades could come to fruition in 2027; we can afford to be patient.
Where We Stand as of 9/30/26
- Gold (held): central-bank demand for reserve diversification
- Short U.S. dollar (held, via long British pound and Japanese yen): capital flows rebalancing away from U.S. assets
- Agriculture (held): long corn, long sugar, short live cattle): crop yields under pressure; cattle cycle nearing a top
- Copper (held): supply/demand imbalance in a metal critical to the energy transition
- Short S&P 500 (watching): late-stage bubble in AI-related stocks
- Long Treasuries (watching): an equity downturn could bring meaningful rate cuts
How This Fits the Fund
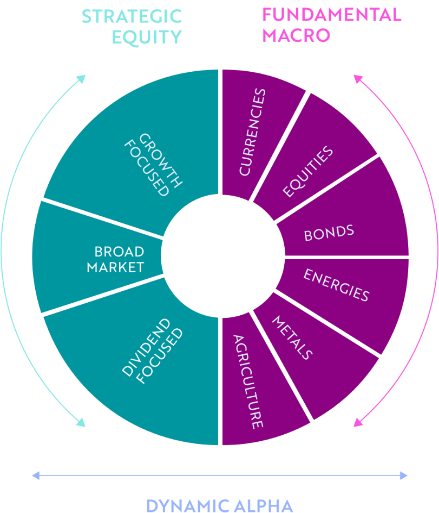
That view on stocks sits alongside the fund’s strategic equity sleeve, roughly half of the portfolio, which stays invested at all times. When our outlook for stocks turns negative and price action confirms it, the global macro sleeve can reduce the fund’s net equity exposure through short stock index futures, rather than by selling the long-term equity holdings.
As always, we remain nimble. If the data and/or our views change, we can pivot our positioning and find other trades within the 40+ markets we have available.
We Are Here To Help
We appreciate your continued trust and partnership and look forward to updating you on our progress in the coming months. Please feel free to reach out if we can provide additional clarification on specific ideas or the portfolio more broadly.
If you are a financial advisor and would like more information on our multi-dimensional approach towards asset management, you can download our white paper titled Busting Seven Risk and Return Myths by visiting our website at DynamicWG.com, or email us at info@DynamicWG.com. If you are an individual investor, we are happy to address any questions you may have and put you in touch with a qualified advisor, if so desired.
Performance Metrics Total returns at NAV (%) through 9/30/26
| CUMULATIVE | ANNUALIZED | |||||
|---|---|---|---|---|---|---|
| 1 Month | 3 Month | Year to Date | 1 Year | 3 Year | Since Incep. (7/31/23) | |
| Dynamic Alpha Macro Fund (DYMIX) | –6.65 | 0.07 | 3.81 | 6.19 | 20.42 | 16.58 |
| S&P 500 Index TR | –0.35 | 2.30 | 12.75 | 15.74 | 22.89 | 19.09 |
| S&P Target Risk Balanced Index TR | –1.80 | –0.60 | 6.82 | 9.43 | 14.66 | 11.87 |
Expense Ratio: 1.81%Fund inception: 7/31/2023
The performance data quoted represents past performance; past performance does not guarantee future results. The investment return and principal value of an investment will fluctuate so that an investor’s shares, when redeemed, may be worth more or less than their original cost. Current performance may be lower or higher than the performance data quoted. Data source: Morningstar. Returns over one year are annualized. Visit www.DynamicAlphaFunds.com for returns updated daily, or call (US Toll Free) 1-833-462-6433 for returns current to the most recent month-end.
Fund Statistics Since inception through 9/30/26 · measured vs. the S&P 500
| Alpha | Beta | Std Dev | Gain Dev | Loss Dev | Sharpe Ratio | Sortino Ratio | Correlation | Up Capture | Down Capture | |
|---|---|---|---|---|---|---|---|---|---|---|
| Dynamic Alpha Macro Fund (DYMIX) | 5.95 | 0.47 | 18.38% | 15.81% | 10.17% | 0.68 | 1.16 | 0.33 | 85.53% | 82.28% |
| S&P 500 Index TR | 0.00 | 1.00 | 12.76% | 12.29% | 5.98% | 1.08 | 2.08 | 1.00 | 100.00% | 100.00% |
| S&P Target Risk Balanced Index TR | –1.68 | 0.63 | 8.78% | 8.04% | 4.66% | 0.80 | 1.33 | 0.92 | 66.03% | 70.63% |
Dynamic Alpha Macro Fund Portfolio Overview
Portfolio Allocation as of 9/30/26
- Global Macro49.8%
- Growth Equities19.9%
- Dividend Equities18.3%
- Core Equities11.6%
- Cash0.4%
Overall strategy allocation is calculated based on amounts allocated to each underlying strategy (Strategic Equity & Global Macro). The Global Macro allocation is based on month-end target account levels.
Contributors
- Long: NY Harbor
- Short: n/a
Detractors
- Long: 5-Year Treasury, British Pound, Copper, Corn, Gold, Japanese Yen, Sugar, Strategic Equities
- Short: E-Mini S&P 500, Live Cattle
Current Positions (as of 9/30/2026)
- Long: British Pound, Copper, Corn, Gold, Japanese Yen, Sugar, Strategic Equities
- Short: Live Cattle
About the Dynamic Alpha Macro Fund
Seeking to generate equity-like returns — differently.
- Combines a fundamental global macro strategy with strategic U.S. equities in a single fund.
- Dynamic rebalancing between the two sides offers the opportunity for “buying low and selling high” — creating what we call “Dynamic Alpha.”
- Seeks equity-like returns with low correlation to traditional stock and bond portfolios.
- It is not another quant / algo-driven strategy — although it can be complementary to those.
Global Macro Investment Universe
Best ideas, long and short, expressed through liquid North American futures markets.

- DJIA
- S&P 500
- NASDAQ
- Nikkei

- Treasury Bond
- 10-Year T-Note
- 5-Year T-Note
- 2-Year T-Note
- SOFR

- Australian Dollar
- Bitcoin
- British Pound
- Canadian Dollar
- Euro
- Japanese Yen
- Mexican Peso
- Swiss Franc

- Crude Oil
- Heating Oil
- RBOB Gasoline
- Natural Gas

- Gold
- Silver
- Copper
- Platinum
- Palladium

- Corn
- Wheat
- Soybeans
- Soybean Oil
- Soybean Meal
- Live Cattle
- Lean Hogs
- Sugar
- Cotton
- Cocoa
- Coffee
The list above is not all-inclusive.
Contact Information for the Dynamic Alpha Macro Fund
If you’re an advisor or investor interested in learning more about the Dynamic Alpha Macro Fund, you can get in touch through the “Contact Us” page on their website at https://dynamicalphafunds.com/contact-us/. Alternatively, you can directly email your inquiries to info@dynamicalphafunds.com.
Important Risk Information
- An investor should consider the investment objectives, risks, charges, and expenses of the Dynamic Alpha Macro Fund carefully before investing. The Fund and summary prospectus contain this and other information about the Fund and should be read carefully before investing. To obtain a prospectus, please call 1-833-462-6433 or access online at https://regdocs.blugiant.com/dynamic-alpha-macro/
- All investment strategies and investments involve the risk of loss. Nothing within this communication constitutes financial, legal, tax, or other advice, nor should any investment or strategy be undertaken without fully understanding all the risks associated with such an investment or strategy.
- The views, opinions, or advice contained above are solely those of the author and do not necessarily reflect those of Ceros Financial Services LLC or its affiliates. The strategies and/or investments referenced may not be appropriate for all investors, as the appropriateness of a particular investment or strategy will depend on an investor’s individual circumstances and objectives.
- Ceros Financial Services, Inc., member FINRA/SIPC, distributes the funds and is a commonly held affiliate of Advisors Preferred. Advisors Preferred and Ceros are not affiliated with the funds’ subadvisor, Dynamic Wealth Group, which serves as the subadvisor to the Dynamic Alpha Macro Fund.
- Any performance figures reported are historical and should not be taken as an indication of future performance. Investment in the financial markets involves risk, and there is always the potential of losing money when investing in securities.
- The views expressed about market trends, including opinions on bonds, equities, gold, crude oil, or any other market, are based on current market conditions and are subject to change without notice. These views should not be construed as a recommendation for any specific investment or financial strategy.
- Discussions of supply and demand, including historical context and future forecasts, involve estimates and assumptions subject to significant uncertainties. Actual future conditions (including oil supply, demand, and prices) may vary markedly from the analysis presented.
- The commentary regarding our trading approach and investment views, including short-term trading outcomes and long-term market predictions, represents the opinions of our investment team at the time of writing. Our commentary does not promise or guarantee future investment strategies or performance.
- Our economic outlook, including any predictions of economic conditions or their impact on investments, is speculative and should not be relied upon for making investment decisions. Economic conditions are complex and can be affected by various unforeseen factors.
- Comments made on third-party sites are the views of the individuals and do not represent the opinions or recommendations of Ceros. Ceros does not monitor or endorse these comments.
- Dynamic Wealth Group (“Dynamic”) is an SEC-registered investment adviser. SEC registration does not constitute an endorsement of Dynamic by the SEC, nor does it indicate that Dynamic has attained a particular level of skill or ability. This material prepared by Dynamic is for informational purposes only. It is not intended to substitute for personalized investment advice or as a recommendation or solicitation of any particular security, strategy, or investment product.
- Opinions expressed by Dynamic are based on economic or market conditions when this material was written. Economies and markets fluctuate. Actual economic or market events may turn out differently than anticipated.
- Facts presented have been obtained from sources believed to be reliable. Dynamic, however, cannot guarantee the accuracy or completeness of such information, and certain information presented here may have been condensed or summarized from its original source.
- Any reference to an index is included for illustrative purposes only, as an index is not a security in which an investment can be made. Indices are unmanaged vehicles that serve as market indicators and do not account for the deduction of management fees and/or transaction costs generally associated with investable products. Past performance is no guarantee of future results. Actual returns may be lower.
- S&P 500 Total Return Index: The Standard and Poor’s 500 is a capitalization-weighted index of 500 stocks representing all domestic industry groups. S&P500TR assumes reinvestment of any dividends.
- S&P Target Risk Balanced Index: The S&P Target Risk Balanced Index is designed to measure the performance of equity allocations, while seeking to provide limited fixed income exposure to diversify risk.
- Definitions — Statistics: Alpha: a measure of an investment’s excess return relative to a benchmark index, after adjusting for the risk taken. Beta: a measure of an investment’s volatility relative to a benchmark index; a beta below 1.00 indicates the investment has been less volatile than the benchmark. Alpha and Beta shown are measured against the S&P 500. Standard Deviation (Std Dev): a gauge of expected volatility; a measure of the dispersion of a set of data from its mean. Gain/Loss Deviation: similar to standard deviation but only considering periods where the investment return was positive (gain dev) or negative (loss dev). Sharpe Ratio: a risk-adjusted measure calculated by dividing annualized excess returns over the risk-free rate by annualized standard deviation; a higher Sharpe ratio indicates better risk-adjusted performance. Sortino Ratio: a variation of the Sharpe Ratio that differentiates harmful volatility from total volatility by using the standard deviation of negative returns (downside deviation). Correlation: a statistical measure of the extent to which two variables change together. Up / Down Capture: a measure of performance relative to a benchmark, showing how much an investment gains in rising markets (up capture) and loses in declining markets (down capture), expressed as a percentage.
- Morningstar Rating is for the Institutional share class only; other classes may have different performance characteristics. No compensation was provided in exchange for this rating. Ratings are calculated monthly and are subject to change. Full Morningstar disclosures and fund information: Important Disclosures.
